

 LinkedIn
Our /blog index logged 3,953 claimed AI bot hits in 30 days. Only 228 passed verification, and just 2 were classified as live answer-time fetches. If an agency puts the first number on a slide and calls it AI visibility, I would ask to see the other two.
That gap is the story in our production edge logs. Category pages drew more than 3,000 claimed hits in aggregate and no observed live-answer fetches. Two dated, data-heavy posts drew 349 such fetches between them. Raw bot volume tells you who requested a URL while claiming to be a bot. It does not tell you whether an assistant retrieved that page while answering someone.
Three numbers that should never share one KPI
I spent years managing Google Ads accounts by hand. I know how easy it is to admire a tall bar on a chart until payroll clears and nobody bought anything. AI visibility reporting has its own version of that bar: the aggregate crawler count.
A User-Agent header is unauthenticated text. A scraper can label a request Claude-User or GPTBot; the label alone does not establish who sent it. Research on claimed AI user agents and analysis of crawler spoofing both illustrate why a claimed identity needs checking. That does not mean every unverified request in our logs was a scraper. It means we cannot count it as a verified provider request.
Here is the distinction our analysis uses:
| Measure | What the log tells us | What it does not tell us |
|---|---|---|
| Claimed bot hits | Requests carrying a bot identity | Whether the sender was that bot |
| Verified crawls | Requests whose identity passed edge checks | Whether retrieval happened during a live answer |
| Answer-time fetches | Verified requests classified as on-demand retrieval | Whether the page was quoted, cited, or clicked |
Our CDN checks claimed bot traffic against providers’ published network information and validation signals. Verified-bot guidance explains the distinction between a bot label and an identity that has passed verification. We then separate background crawlers from on-demand user agents; crawler and agent behaviour differs, even when both arrive in a server log.
If you want to inspect the same problem on your own domain, start with your server or CDN records, not a dashboard’s bot total. Our curl and CDN audit is one way to check whether an assistant can reach a page. Do not promote a User-Agent string into a visibility metric without verifying the request behind it.

The homepage was busy; the article winners were narrow
After verification, we grouped the leading routes by claimed hits, verified requests, and answer-time fetches. The figures below come from 30 consecutive days of kindredworkshop.com production edge logs. They count requests, not unique people, prompts, citations, or revenue.
| URL or content asset | Claimed bot hits | Verified crawls | Answer-time fetches | Leading on-demand agent in the log |
|---|---|---|---|---|
/ (homepage) | 4,120 | 1,840 | 984 | ChatGPT-User (941 fetches) |
/robots.txt | 2,890 | 1,510 | 1,206 | Claude-User (1,206 fetches) |
/post/google-ads-updates-2026 | 1,420 | 462 | 208 | ChatGPT-User and Perplexity |
/post/ai-max-setup-performance-guide | 980 | 315 | 141 | Claude-User and ChatGPT-User |
/blog (index) | 3,953 | 228 | 2 | Not specified |
| Category pages (aggregate) | 3,110 | 140 | 0 | None observed |
The homepage’s 984 answer-time fetches include 941 from ChatGPT-User. A root URL is an obvious place for an agent to check what a business says about itself. The logs show that the fetches happened; they do not show the prompts that preceded them or whether the homepage appeared in a final answer.
The /robots.txt row needs even more care. Its 1,206 answer-time fetches, all classified here as Claude-User, are requests for a permissions file, not 1,206 readings of our articles. Anthropic distinguishes Claude-User retrieval from ClaudeBot crawling. That makes the permissions-file traffic worth watching, but it is not editorial visibility. Counting it alongside article fetches without labelling it would produce another impressive, misleading bar.
The editorial signal sits further down the table. Our Google Ads updates post logged 208 answer-time fetches; the AI Max setup guide logged 141. Together, those two URLs accounted for 349. The /blog index, despite nearly 4,000 claimed bot hits, logged 2.
That contrast is more useful than a domain-wide total. An assistant seeking information about an update or a setup step has a reason to retrieve a specific article. An archive offers links and previews, not much of an answer on its own. The logs cannot tell us why an agent chose a URL, but they show clearly where on-demand retrieval concentrated during this window.
The category-page row makes the same point with an important qualification: 3,110 claimed hits across category pages, 140 verified crawls, and no observed answer-time fetches in the routes we analyzed. The draft version of this finding could easily become “3,000 hits per category page.” That is not what the aggregate row says. It is still a poor case for celebrating raw bot traffic.
Traditional referral analytics pick up visits after someone follows a link. They miss the retrieval that may happen before an assistant produces an answer; server-log analysis addresses that blind spot. Logs do not solve the whole attribution problem either. A verified fetch is evidence of retrieval, not evidence of a citation, a click, or a customer. Use it as an operational signal, not a revenue claim.
Why the two posts are more useful than their hit counts
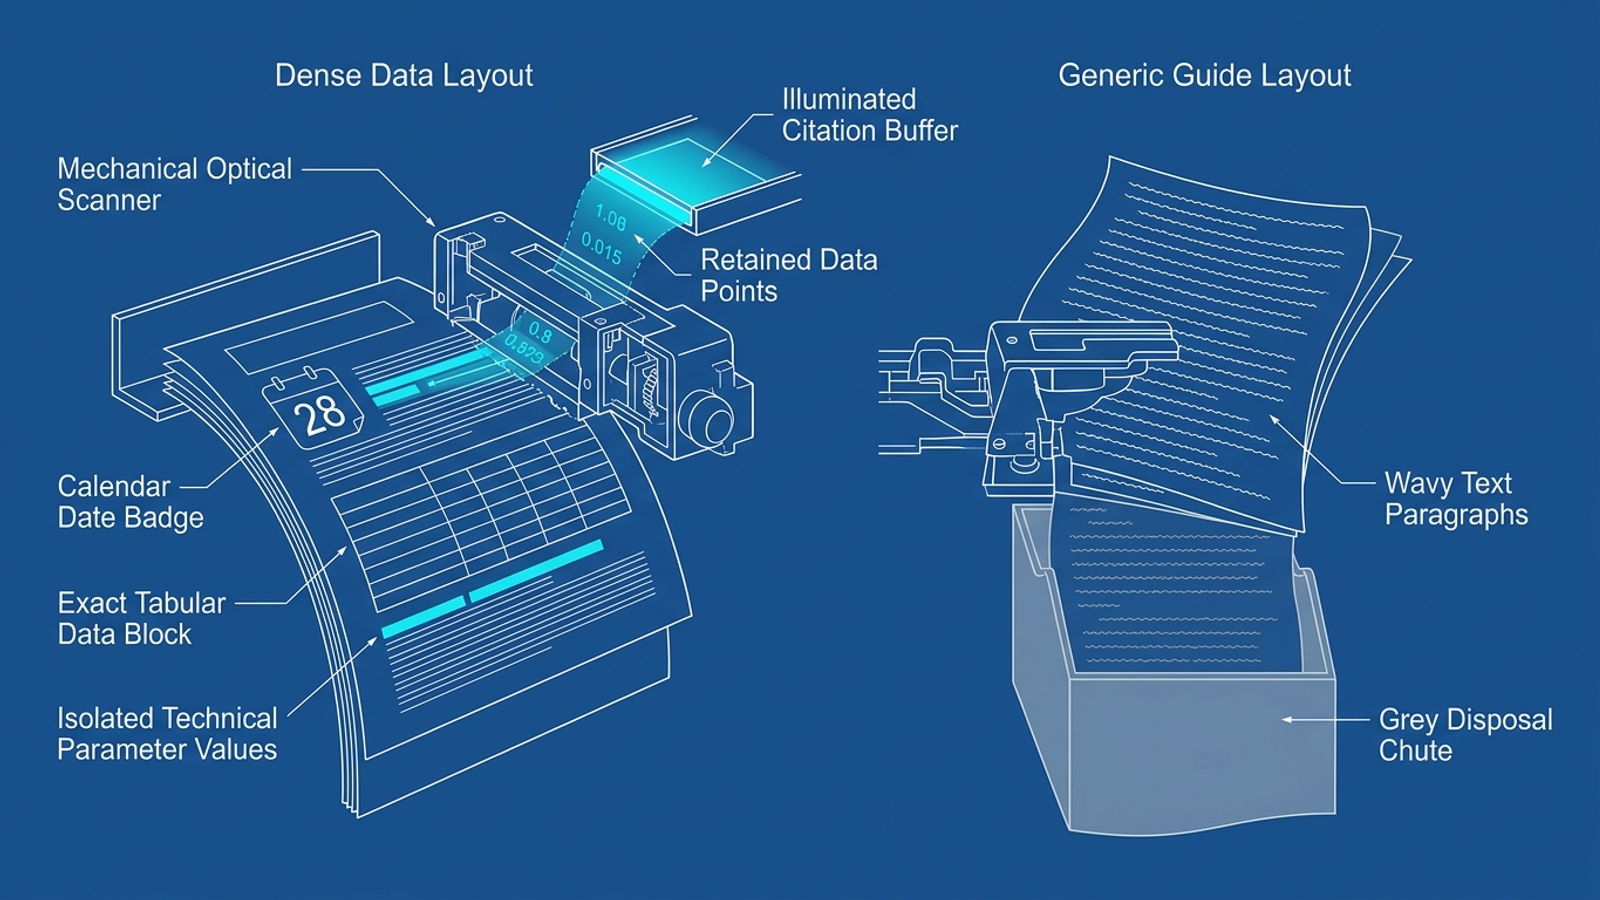
The two articles with 349 combined answer-time fetches have something in common: they give a reader concrete material to check. One addresses Google Ads updates for 2026. The other walks through AI Max setup and performance. Both put operational detail close to the top instead of making a reader wade through an industry overture first.
The shared features are easy to scan:
- Dates and version markers give a change a place in time. That matters when a reader needs to know whether a setting or rollout description is current.
- Operational parameters put settings, targets, and budget mechanics where someone trying to act on the information can find them.
- Tables make comparisons visible without asking a reader to reconstruct them from several paragraphs.
I would not turn that list into a universal ranking formula. These are two posts on one site over one month. The logs show that they drew on-demand retrieval; they do not run an experiment proving that a table caused any particular fetch. Still, if I were choosing between another broad archive page and a post that states a change, its date, and its practical mechanics, I know which one this dataset gives me a reason to publish.
That is a narrower and better argument than “AI hates good writing.” A useful explanation can have voice. It just should not hide the date, setting, or constraint someone came to check. Put the answerable detail where a reader can reach it. The assistant is not the only visitor who benefits.
Where this month of logs stops talking
I have run enough ad split-tests to be wary of a neat story assembled from one account. This is a 30-day view of one B2B site, not a benchmark for every publisher or store. Before borrowing its editorial lesson, keep three boundaries in view:
- The site matters. groas publishes search-marketing content. A retailer with a large product catalogue offers different kinds of pages and answers. This analysis does not measure that retailer’s retrieval pattern.
- The route view has a tail. High-volume edge-path reporting truncates lower-traffic paths. Absence from the leading-route table does not prove a page received no requests during the month.
- The month matters. Retrieval demand can change as topics and indexing cycles change. These figures describe this window; they do not forecast the next one.
There is a fourth boundary worth repeating because the terminology invites overreach. We classified requests from on-demand agents as answer-time fetches. We did not observe the human prompt, the assistant’s finished answer, or a citation in that answer. In particular, zero observed fetches for the category routes in this analysis is not proof that no assistant has ever used a category page. It means those pages did not register an answer-time fetch in the analyzed routes and window.
None of those limits rescues the raw-hit metric. On /blog, the observed count fell from 3,953 claimed hits to 228 verified requests to 2 answer-time fetches. Verification and request type changed what the number meant. Keep those columns separate before you draw a conclusion from any of them.
The Monday-morning report I would actually use
I would retire the single “AI crawler hits” KPI. It mixes unverified claims, background crawling, permissions checks, and retrieval of content pages into one number. That may be convenient for a slide. It is a lousy way to decide what to publish or improve.
The replacement is a short, repeatable per-page report:
- Verify identity at the edge or in log processing. Check claimed agents against the relevant provider’s published validation information. Keep requests that fail verification in their own column rather than silently assigning them to a provider.
- Separate request types. Report background crawls, permissions-file checks, and verified on-demand fetches independently. A fetch of
/robots.txtis not a fetch of an article. - Review answer-time fetches by URL. Compare specific content pages over time. Keep the raw and verified counts beside them so nobody mistakes a scraper surge for new demand.
- Use the finding to choose work. If detailed posts repeatedly draw retrieval while archive pages do not, test more posts that put dates, settings, and comparisons up front. Check the next window rather than declaring a permanent rule.
That report does not require an agency to reinterpret an aggregate chart every month. A regular edge-log query can establish the baseline. Nor would I treat a synthetic prompt dashboard as a substitute: tools that poll models with preset prompts answer a different question from “which of our URLs did verified agents request?” If you use both, label both. Do not let a simulated prompt result stand in for observed traffic.
I would be just as strict with our own tooling claims. The groas MCP integration may be part of how a team works with groas, but an integration link is not proof that any particular edge-log field is available through it. First establish which logs you can access and what you can verify. Then decide how to review them. The source of truth is the request record, not the polish of the interface.
Stop paying for the tall bar
Performance marketing has a simple test for a metric: can it help you make a better decision? A claimed bot count fails when anyone can supply the claim in a request header. A verified answer-time count by content URL is narrower, but it tells you which pages an on-demand agent actually fetched in the period you measured.
On our site, that distinction turned 3,953 /blog hits into 2 observed answer-time fetches, while two specific posts drew 349 between them. It does not prove a citation or a sale. It does tell me where to look next, what sort of content to test, and which agency chart I would stop paying to admire. Filter the logs. Follow the page-level retrieval. Let somebody else optimise for scrapers.